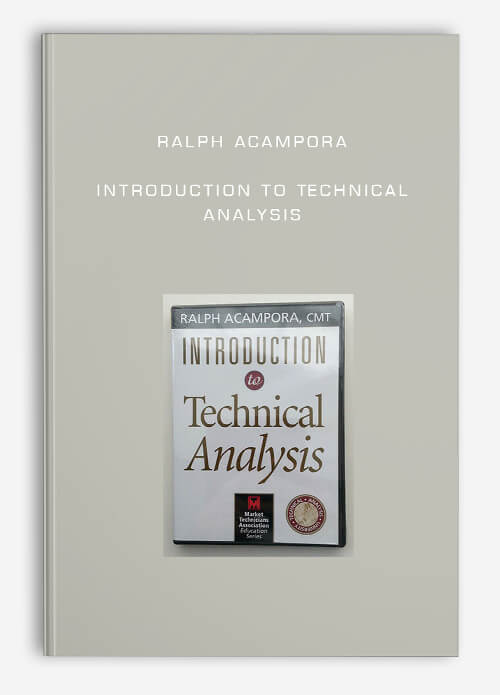
Ralph Acampora – Introduction to Technical Analysis
Description
Ralph’s charismatic personality opens the door to technical analysis and welcomes you in. He clearly explains the most basic elements of technical analysis like:
-Why the market is a leading economic indicator and what it means to your trading
-What almost killed technical analysis and why it was wrong
-What books you should read and what books you should burn
-Why in price there is knowledge and in volume there is truth.
With simple, accessible clarity, this course introduces the four types of charts and shows how they are constructed. Line charts, Bar Charts, Candlestick Charts, and Point and Figure Charts. After this easy to watch course, these charts will no longer be a foreign language. Now they will be powerful tools that give you insight into what the market is going to do and how you can benefit from that information.
JACKET DESCRIPTION:
From the MTA Education Seminar 2005 –
Technical Analysis University
INCREASE YOUR PROFESSIONAL FINANCIAL SKILL SET BY ADDING TECHNICAL TOOLS
Our Technical Analysis University faculty consists of five of the most well-known technicians in the world. This session is designed for portfolio managers and fundamental analysts who are looking for an intensive one-day course on technical analysis. In just one day, attendees will come away with an understanding of how various charts are constructed and interpreted. The course will cover integrating technical analysis with fundamental analysis and using technical analysis to quickly get an overall sense of the direction of the equity, fixed income, commodity and currency markets, and use movements in one to forecast another.
This one-day event, captured on disc, brings together five notable technicians to educate newcomers to technical analysis on the basics of technical analysis in a series of five one-hour classes. Topics range from basic chart construction, to advanced charting such as point & figure and Japanese candle charting.
Attendees, and now viewers, will learn from one of the most experienced individuals to hold both the CFA and CMT charters on how to meld these two approaches to identify promising investment opportunities. Legendary technician John Murphy wraps up the day with a session on intermarket analysis, explaining how the charts of commodity, currency, bond and equity markets can be used in conjunction with one another to get a broad overall read of the state and likely future direction of global markets. The presentations include a significant amount of time for one-on-one interactions as well as Q&A opportunities with these technicians.
Technical Analysis Course
How to understand about technical analysis: Learn about technical analysis
In finance, technical analysis is an analysis methodology for forecasting the direction of prices through the study of past market data, primarily price and volume.
Behavioral economics and quantitative analysis use many of the same tools of technical analysis, which,
being an aspect of active management, stands in contradiction to much of modern portfolio theory.
The efficacy of both technical and fundamental analysis is disputed by the efficient-market hypothesis, which states that stock market prices are essentially unpredictable.


![Mark Douglas – Trading Psychology [4 mp3]](https://vincourse.info/wp-content/uploads/2020/01/Mark-Douglas-–-Trading-Psychology-4-mp3-350x350.jpg)


Lord –
This is Digital Download service, the course is available at Coursecui.com and Email download delivery.