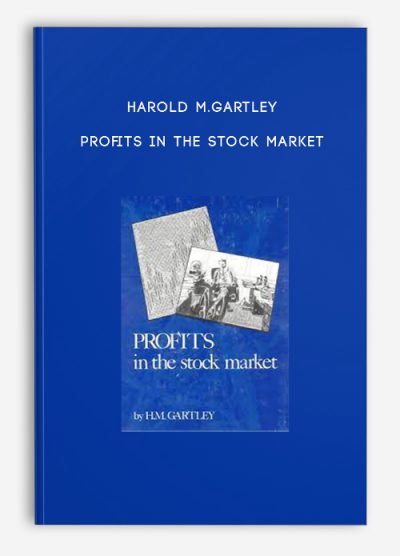
Harold M.Gartley – Profits in the Stock Market
Description:
We have added a long lost piece of H.M. Gartley’s work to this new paperback edition of Profits in the Stock Market;. 2012
Gartley’s Stock Market Experience Tables, a full 123 page addition to the already large-Profits in the Stock Market makes this a 569 page mammoth of a book. Written in 1940, Gartley provides us with a complete study of what he calls Relative Velocity, which we now call Relative Strength.
Two full books in one, complete with a full packet of charts.
Profits in the Stock Market is more of a course in chart reading and stock trading, it comes with nearly 40 historical charts to refer to. We believe that Mr. Gartley and Mr. Gann may have known each other and although the chart reading and interpretation techniques within this book are different than what Mr. Gann teaches, there are moments of similarity that may help unlock some of Mr. Gann’s teachings. Still, this book stands on it’s own as one of the greatest chart reading and interpreting masterpieces of all time. Techniques taught can be applied to commodities. Due to the size of this book, including the large package of charts that come with it, this book should really be considered a course on chart reading.
Before being republished in 1981, copies of this 1935 classic were selling for $1800. Now the same text and very large package of accompanying charts are available again. In fact, the chart package alone is worth many times the cost of the book. This is one of the classic books written on the art of chart reading, chart interpretation and stock trading.
The fundamentals Mr. Gartley explains are as valid today as when they were formulated. Plus, the techniques taught can be applied to commodities trading, with some slight modification. Put the tested logic of this highly successful trader and this highly acclaimed book to work for you. A book/course that will compliment Mr. Gann’s teachings.
Some subjects covered are:
The Technical Approach
Charts – The Averages
A Chart Portfolio
Long Term and Major Trends
The Intermediate Trend
The Minor Trend
Tenets of the Dow Theory
Triangles
Trend Lines
Moving Averages
Volume
Oscillators
Caps
and much more. The Chart package includes nearly 40 large charts to follow and study. Truly a remarkable find for the serious trader.
Bond -Stock Trading course: Learn about Bond -Stock Trading
Bond trading definition
Bond trading is one way of making profit from fluctuations in the value of corporate or government bonds.
Many view it as an essential part of a diversified trading portfolio, alongside stocks and cash.
A bond is a financial instrument that works by allowing individuals to loan cash to institutions such as governments or companies.
The institution will pay a defined interest rate on the investment for the duration of the bond, and then give the original sum back at the end of the loan’s term.
A stock trader or equity trader or share trader is a person or company involved in trading equity securities.
Stock traders may be an agent, hedger, arbitrageur, speculator, stockbroker.
Such equity trading in large publicly traded companies may be through a stock exchange.
Stock shares in smaller public companies may be bought and sold in over-the-counter (OTC) markets.
Stock traders can trade on their own account, called proprietary trading, or through an agent authorized to buy and sell on the owner’s behalf.
Trading through an agent is usually through a stockbroker. Agents are paid a commission for performing the trade.
Major stock exchanges have market makers who help limit price variation (volatility) by buying and selling a particular company’s shares on their own behalf and also on behalf of other clients.
Preview Information:
More Course: BOND – STOCK
Outstanding Course:Larry Connors – Connors on Advanced





Lord –
This is Digital Download service, the course is available at Vincourse.com and Email download delivery.